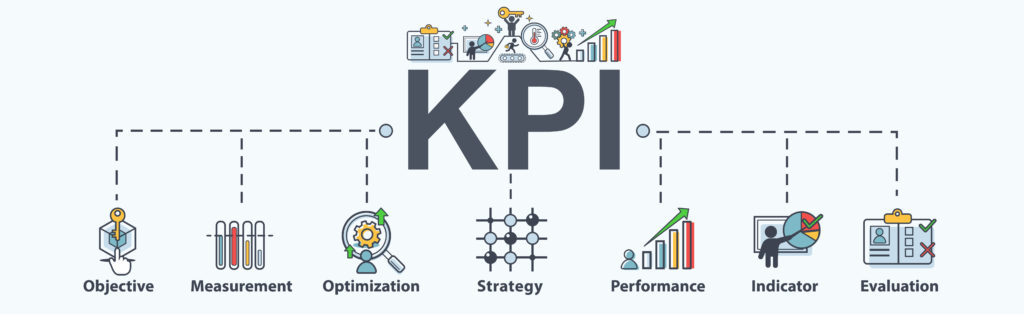
What are the Financial KPIs
The financial KPIs or Financial Key Performance Indicators are metrics used to track, measure, and analyze the company’s financial health. For example, you can use financial KPIs to measure the metrics of profitability, liquidity, solvency, efficiency, and valuation.
The Use:
Once you obtain the metrics, you can adjust and make changes to better the financial health of your business. You can also develop strategies to work on critical financial areas either to increase profit and equity or lower expenses.
A critical step when using KPIs is to share the information. In addition, it is necessary to keep all your team aware of the indicators and the outcomes.
How does the Financial Statement Analysis work with the KPIs?
Financial statement analysis is an essential process that works hand in hand with KPIs to evaluate the key financial performance of a business. Financial statements provide crucial information about the company’s financial position, profitability, and cash flow. Here’s a breakdown of how financial statement analysis aligns with KPIs:
-
Balance Sheet: The balance sheet provides a snapshot of the company’s financial position at a specific point in time. It presents the assets, liabilities, and owner’s equity of the business. By analyzing the balance sheet, you can assess factors such as liquidity, solvency, and capital structure, which are important for evaluating financial health.
-
Income Statement: The income statement summarizes the revenues, expenses, and profits or losses of the business over a specific period, usually a fiscal year or quarter. It helps in understanding the company’s profitability and performance. By analyzing the income statement, you can calculate profitability ratios and measure the efficiency of revenue generation and expense management.
-
Cash Flow Statement: The cash flow statement tracks the inflow and outflow of cash in the business over a particular period. It shows how cash is impacted by the actions recorded in the balance sheet and income statement. The cash flow statement is divided into three categories: operating activities, investing activities, and financing activities. It provides insights into the company’s liquidity, ability to generate cash, and cash management practices.
-
Annual Report: The annual report provides a comprehensive overview of the company’s financial health, performance, and future prospects. It combines information from financial statements, management analysis, and other relevant details. The annual report often includes discussions on financial KPIs, highlighting key metrics and their interpretation.
By conducting a thorough financial statement analysis, considering the balance sheet, income statement, cash flow statement, and annual report, you can gain a holistic understanding of the company’s financial health and performance. This analysis helps identify strengths, weaknesses, areas for improvement, and potential risks, which can then be linked to the corresponding financial KPIs for effective monitoring and decision-making.
The Best Performances Measures you Should do to Monitor Your Business
The financial statement will offer information to maintain vigil over the performance of the business phases. This is a job that strategic financial stakeholders constantly should monitor.
Gross Profit Margin
To obtain the Gross Profit Margin is a measure of profitability, you subtract the cost of goods sold from the revenue. Then, measure this margin as percentages. The COGS or cost of goods sold doesn’t reflect the operational expenses, interest, or taxes, only the cost of production. In other words, it doesn’t account for overheads.
The formula for Gross Profit Margin is:
Gross Profit Margin = (Revenue – Cost of Sales) / Revenue * 100
Net Profit Margin
The Net Profit Margin shows the profit left after paying for all business costs. All business costs include COGS, operation expenses, interest, and taxes.
The main purpose of Net Profit Margin is to show you the profitability of the business after expenses.
The formula for Net Profit Margin is:
Net Profit Margin = Net Profit / Revenue * 100
Working Capital
Working Capital is the assets, like cash, to keep the day-to-day operations of the business, such as cash, that are available to support the day-to-day operations of the business. If your working capital is low, you need to lower your expenses.
The formula for Working Capital is:
Working Capital = Current Assets – Current Liabilities
Current Ratio
The current ratio measures the company’s ability to meet short-term liabilities using its current assets. The Current Ratio is the number of assets that can be turned into liquid assets and can be used to pay for the business responsibilities (liabilities) within a short period of time, for example, a year. If, after doing the math, you find out that the outcome is lower than liabilities, you need to start designing strategies to lower the business responsibilities and increase the assets.
The formula for the Current Ratio is:
Current Ratio = Current Assets / Current Liabilities
Quick Ratio
The Quick Ratio also known as the acid-test ratio, is similar to the current ratio but focuses only on highly liquid current assets such as cash, securities, and accounts receivable. It helps assess the business’s ability to meet short-term liabilities without relying on inventory. It is similar to the Current Ration. Thus, the primary purpose of the Quick Ratio is to handle short-term responsibilities or liabilities.
It should be something that can be turned into cash fast.
The formula for the Quick Ratio is:
Quick Ratio = (Current Assets – Inventory) / Current Liabilities
Leverage
Leverage is another type of method, also known as equity multiplier. Measures how much a business uses debt (leverage) to finance its assets. It assesses the risk associated with taking on debt and its potential impact on equity holders’ profits. In other words, the main use of it is to buy assets through debt, for example, taking a loan to remodel.
The business takes debt instead of using equity with the idea that the after-tax profit to equity holders will exceed the borrowing cost. This also can put the business at risk if too much debt is taken.
The formula for Leverage is:
Leverage = Total Assets / Total Equity
Debt-to-Equity Ratio
Debt to Equity Ratio is similar to Leverage, but it uses equity over debt. Thus, it shows the solvency of the business over the responsibilities (obligations) using equity.
The formula is:
Debt to Equity Ratio = Total Debt / Total Equity
Inventory Turnover
Inventory turnover is perfect to understand the ratio of inventory over sales. First, it gives a view into whether a business has excess inventory related to its sales levels. Second, it shows the number of times the business sold all its inventory.
The formula is:
Inventory Turnover = Cost of Sales / (Beginning Inventory + Ending Inventory / 2)
Total Asset Turnover
The Total Asset Turnover is to measure the efficiency ratio of the use of assets to generate revenue. Therefore, the best way to see how a business is performing is by using Total Asset Turnover.
The formula is:
Total Asset Turnover = Revenue / (Beginning Total Assets + Ending Total Assets / 2)
Return on Equity
Return on Equity or ROE is a widely used term.
It measures the profitability ratio by dividing the net profit over shareholder’s equity. The main purpose is to demonstrate the efficiency of using equity investments to earn profit for investors.
The formula for ROE is:
ROE = Net Profit / (Beginning Equity + Ending Equity) / 2
Return on Assets
Return of Assets or ROA measures how well the business is managing its assets to net higher profits.
The formula is:
ROA = Net Profit / (Beginning Total Assets + Ending Total Assets) / 2
Operating Cash Flow
It measures the amount of cash the business has due to its operations. If the Operating Cash Flow analysis is positive, you have the cash to grow; negative means you need cash to keep the business operating. It is found on the cash flow statement and is calculated using one of these methods:
-
The direct method: under this method, the cash flows from operating activities will include the amounts for lines such as cash from customers and cash paid to suppliers
- Indirect method: will show net income followed by the adjustments needed to convert the total net income to the cash amount from operating activities.
Monitoring and analyzing key performance indicators (KPIs) and financial statements are essential for assessing the financial health and performance of a business. KPIs such as gross profit margin, net profit margin, working capital, current ratio, quick ratio, leverage, debt-to-equity ratio, inventory turnover, total asset turnover, return on equity (ROE), return on assets (ROA), and operating cash flow provide valuable insights into various aspects of a company’s financial position, profitability, efficiency, liquidity, and risk management. By regularly tracking these measures, businesses can make informed decisions, identify areas for improvement, and develop strategies to enhance their financial performance and overall success.