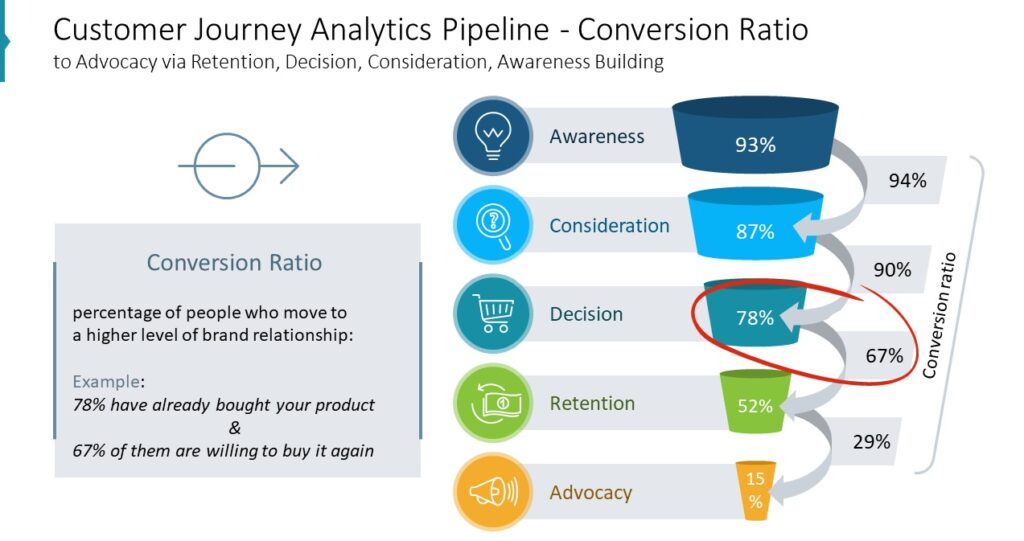
How to Gather Data for Analytics to the Customer Journey

The Customer Journey is the process a potential customer goes through before a sale or purchase. Therefore, when talking about eCommerce analytics, business personnel get overwhelmed by the amount of information in analytics. Instead of understanding why and what information is needed, some business owners follow their years of experience or just their gut feeling.
However, how do you know if you are doing the processes correctly without data analysis? Don’t worry; here is a beginner’s guide to help gather the essential data you need to learn the process.
How to Gather Information for Customer Journey Analytics
Awareness
Awareness is the state of getting acquainted with something, in this case, a brand or a product. This is, marketers generate unique campaigns to work with the desired message and attract more people to like the brand or product. It can work on the psyche of emotions.
The awareness’s powerful effectiveness is when the Campaign delivers target stimuli towards
- helping others,
- promoting a problem-solving message,
- acting upon the beliefs or feelings.
Therefore, good marketing can make potential clients aware of possible needs or problems that otherwise would have gone unnoticed.
Another essential aspect of awareness is the capability to develop brand trust. In other words, the marketer delivers messages and uses mechanisms that make customers recognize the brand and trust it. However, some campaigns focus on humanizing the brands or products to get close to the customers’ psyche.
To make this task more accessible, the marketer must know their target using demographic, geographic, personal interest, social communications, email, and behavioral data. Then, the marketing team develops a customer persona (AkA as an ideal buyer or customer). This persona represents the actual customers similar to the one being described.
Analytics help you achieve this awareness by providing all the specific information you need. However, the customer must give their data voluntarily.
Which metrics are most important in Awareness:
Market Reach:
-
- Refers to the estimated number of potential consumers a specific marketing campaign can reach. For example, designing an awareness marketing campaign for a segmented target will only get a percentage of those potential customers. Thus, you will never reach 100% of the market, maybe 2%. The portion you reach becomes smaller once the potential consumer starts to go through the customer’s journey.
What do you gain out of Market Reach?
Market reach allows you to make precise and effective decisions. For example, you can minimize investing in areas where the risk of losing money is high or your ROI is lower (return of investment).
Hence, analytics can help you reduce risks by applying the correct strategies in the proper channel.
The numbers won’t fail you. You can design successful marketing tactics based on your target when you have the correct data. This way, analytics will help you determine your potential consumers’ channel. Also, it allows you to be more specific about the marketing with more strong possibilities of conversion.
Calculating Marketing Reach
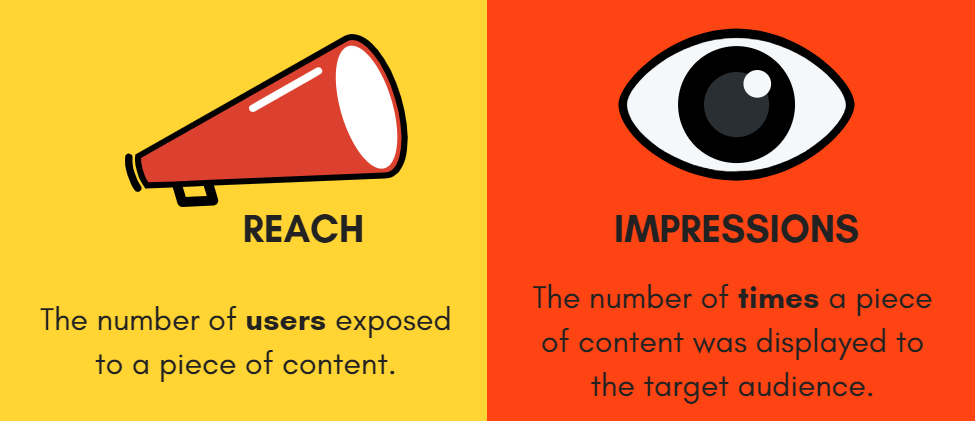
The basic formula for calculating reach is impressions divided by frequency (reach = impressions/frequency)
- Impressions: refers to the number of times a potential consumer sees an ad or gets in contact with a marketing campaign. By keeping track of the impressions, you can combine them with other metrics and develop better ads.
You calculate Impressions by multiplying the number of Spots by Average Persons (spot (channels) is a single broadcast of an advertisement). Usually, an advertising location includes multiple spots.
- Engagement Metric: this strategy counts the number of potential consumers interacting with your ads. Base the importance on increasing the chances of becoming actual customers.
Calculate Engagement rate as the total number of interactions your content receives divided by your total number of followers, multiplied by 100% ([ Interaction Rate= (Total interactions ÷ pages liked at the time of posting) x 100])
- Search Volume: This metric shows the number of people seeking something specifically related to specific marketing. Search volume is significant because it reflects the effectiveness of a campaign, increasing ROI.
Average monthly search volume formula: number of times potential customers searched a keyword over the past twelve months divided by 12.
- A keyword analysis is a process of finding keywords or phrases that get your potential consumer closer to your site or product. Find keywords with high search volume but lower competition.
Consideration
Consideration is the part of the customer journey where the potential consumer evaluates the solutions for their needs or problems. Let’s say that you already called the attention of your prospected consumer. Afterwards, the potential consumers should start to inquiring about the brand and the possibilities of finding a product that fits their needs. During this phase, the brand receives the most scrutiny, and you need to give the potential client a great deal of information.
Use customer journey analytics to identify which touchpoints are helpful and give more opportunities for contact with the potential consumer. Therefore, eliminating those you are spending money on, but the effect is limited or useless.
Use customer journey analytics to compile metrics of the number of potential consumers visiting your store. For this, develop a strategy to capture the personal information of the potential client, like emails or a landing page. Then start by working on your personalized tactics.
What type of metric you can use for Consideration:
- Click through Rate (CTR): it’s the ratio of clicks on pages, ads, emails done by potential consumers. Using these metrics helps you know if the marketing campaign was successful.
Formula: clicks ÷ impressions= CTR (done per spot or channel (ad, listing, keyword))
- Cost per Lead (CPL) to know how much it costs per lead on a specific channel. This information indicates the effectiveness of the Campaign and ROI (Return of Investment)
Formula: CPL= advertising spending ÷ number of attracted leads
- Cost per Acquisition (CPA): to know the cost of getting a conversion (new consumer).
Formula: CPA= total Campaign cost ÷ conversions
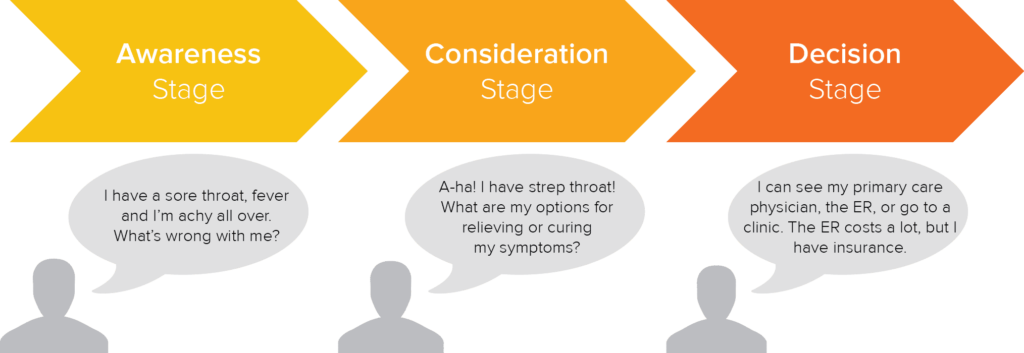
Decision or Purchase (conversion)
The decision or purchase has taken place. It refers to the process of conversion, which indicates the transition of a potential customer to a client. Now you need to keep the trust. It would help if you worked on transforming a customer into a loyal customer. In other words, you have to keep giving value to the customer.
But before you start the next step, you need to know what your actual conversion rate is.
- Sales conversion rate: the percentage of visitors who purchase your online store
Formula: Sales conversion rate=number of conversions ÷ total number of visitors
- Average order value (AOV): the average amount of money spent per purchase
Formula: AOV= Revenue ÷ number of orders
- Cart abandonment rate: the number of customers who abandoned products on your site’s cart.
Formula: Cart abandonment rate = (1- (number of orders completed ÷ number of charges initiated) x 100
Retention
You have earned your customer’s trust. Now you have customers or loyal customers. Your products, services, quality of marketing campaigns, in short, everything has worked. You already have a client who has great potential to continue being faithful to your brand.
Making innovations help you through the process of retention. It is essential to stay updated, trendy, and dynamic.
Businesses know the importance of loyal customers. Retaining customers is always less expensive than finding new ones. “The bottom line: Increasing customer retention rates by 5% increases profits by 25% to 95%”, retentionscience.com.
Some metrics that help you measure customer retention:
- Customer lifetime value (CLV): refers to the total purchase amount a client is expected to spend on a business during their time as a loyal client.
Formula: Lifetime Value= Average Value of Sale x Number of transactions x Retention Time
(Formula for the retention time: [CRR=((E-N)/S) X 100] (E=customers at the end of a period (week, month, quarter), N= customers acquired during the period customer during same period, S= customers at the start of the period)
- Customer Retention Rate: percentage of customers a business has been able to keep
- Churn Rate: percentage of customers
Advocacy
No doubt you have great customers beyond does regular shoppers. You have people who are willing to recommend your products and site. Shoppers that reach this stage are far more than regular customers. They are your brand ambassadors.
The best way to verify this rate is through surveys.
Formula: Net Promoter Score= (Number of Promoter Scores/Total Number of Respondents) – (Number of Detractor Scores/Total Number of Respondents)
- Promoters: your most loyal customers
- Detractors: unhappy customers, those who stop shopping and may prevent others (those writing bad reviews)
The cornerstone of success is creating a competitive customer experience. Thus, the best experiences can be by incorporating analytics. Incorporating eCommerce analytics does much more than numbers; it will state the optimizing directions you need to increase acquisition, up to advocacy.